0

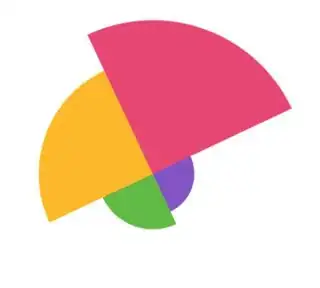
I have a requirement for a chart that looks as such:

enter image description here

I found Chart JS' Polar Area Chart, but it's not rotated as I needed.

enter image description here

And since Chart JS doesn't seem to have a rotate property, I tried just rotating the canvas with CSS

        #myChart {
            -webkit-transform: rotate(-25.2deg);
            transform: rotate(-25.2deg);
        }

This gets the desired rotation, but as you can see, the tooltips are also shifted, and any nearby divs could be obscured by the rotated canvas:

enter image description here

Is there some feature/method I'm overlooking to rotate a polar chart without manipulating the canvas?

user3871
  • 12,432
  • 33
  • 128
  • 268

2 Answers2

2

There's no way to rotate the chartJS but not rotate the tips :-\

On the bright side, it's easy enough to code yourself from previous Stackoverflow posts!

A polar chart is a set of concentric wedges as shown in this Stackoverflow post:

Creating Polar Area Chart using Canvas

Tooltips are just text drawn at a specific wedge when the mouse hovers over that wedge. Here's a Stackoverflow post showing how to use context.isPointInPath to draw a tooltip if the mouse is hovering inside an irregular path (like your wedges):

HTML Canvas Hover Text

Community
  • 1
  • 1
markE
  • 102,905
  • 11
  • 164
  • 176
0

Put "rotation:90" or whichever value works the best for you. This option has been added in the last version of ChartJs

Bastien Bastiens
  • 419
  • 6
  • 16
  • A link to the docs or pull request would be helpful here, or some more information. For example I placed ```rotation: 90``` under the `tooltip` key and nothing happened, so I'm assuming I'm putting the property in the wrong place... – Sheldonfrith Jan 01 '23 at 17:52